Decarbonisation
Last update: November 2022
The 14th Five Year Plan made a world media sensation for its pledge to peak CO2 emissions by 2030 and achieve carbon neutrality by 2060; some commentators celebrate the Plan as the China’s blueprint decarbonisation and the jumpstarting of China’s industrial decarbonisation revolution, others are very sceptical and think about the pledges just for the sake of form.
After China surged as the Largest Economy in backing up Paris Agreement, after US withdrawal, a declaration about the timings for the peak emissions and the carbon neutrality was the least political commitment to undertake, which China delivered in the first available framework programme.
Anyway, 121 Countries out of the 190 enforcing the Paris Agreement[1], together with the European Union, already pledged to achieve carbon neutrality by 2050: China’s choice delays its carbon neutrality by 10 years.
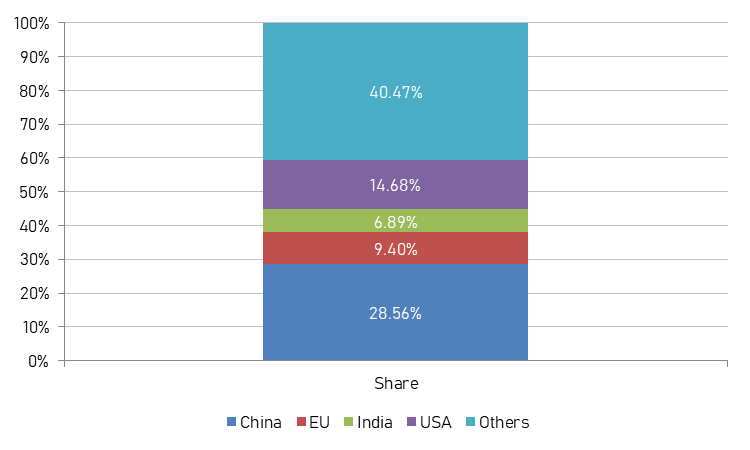
In 2018, China accounted for 28,56% of the World CO2 emissions, around double than USA and three times than European Union (Figure 9); such huge amount in itself has measurable consequences onto China.
For instance, the climate change is quickly melting the glaciers of the Hindu-Kush-Himalayas region, the so called “Third Pole”, that is the water source of all the major rivers between India and China, including the Yangtze River[2].
China is struggling with climate adaptation along the Yangtze River since many years, with violent floods and unpredictable droughts, that, in combination with severe pollution and water exploitation, raised so much concern to the point that president Xi Jinping took action on his own motion: on January 2016, after an inspection visit in Chongqing, he ruled out major development projects along the Yangtze River at a top-level meeting to finalize guidelines for the economic belt along the river, he urged officials from Provinces along the river to concentrate on ecological restoration and protection and to avoid large-scale development. The same year, the central government issued a plan for the Yangtze River Economic Belt to coordinate a balanced and sustainable development in the region, which covers 11 provinces and municipalities, including Hubei, Hunan, Shanghai and Chongqing, and is home to about 40 percent of the country's population and GDP.
China is in need to take action against climate change because the fall out of its own emissions are already affecting the Country’s development.
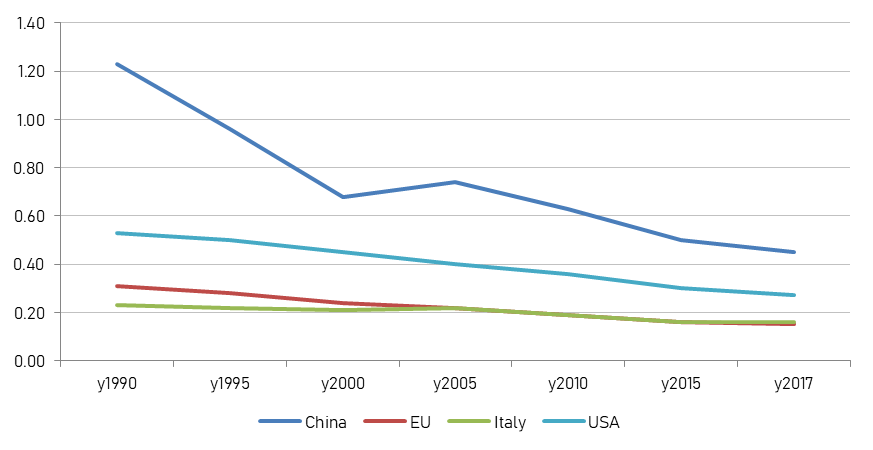
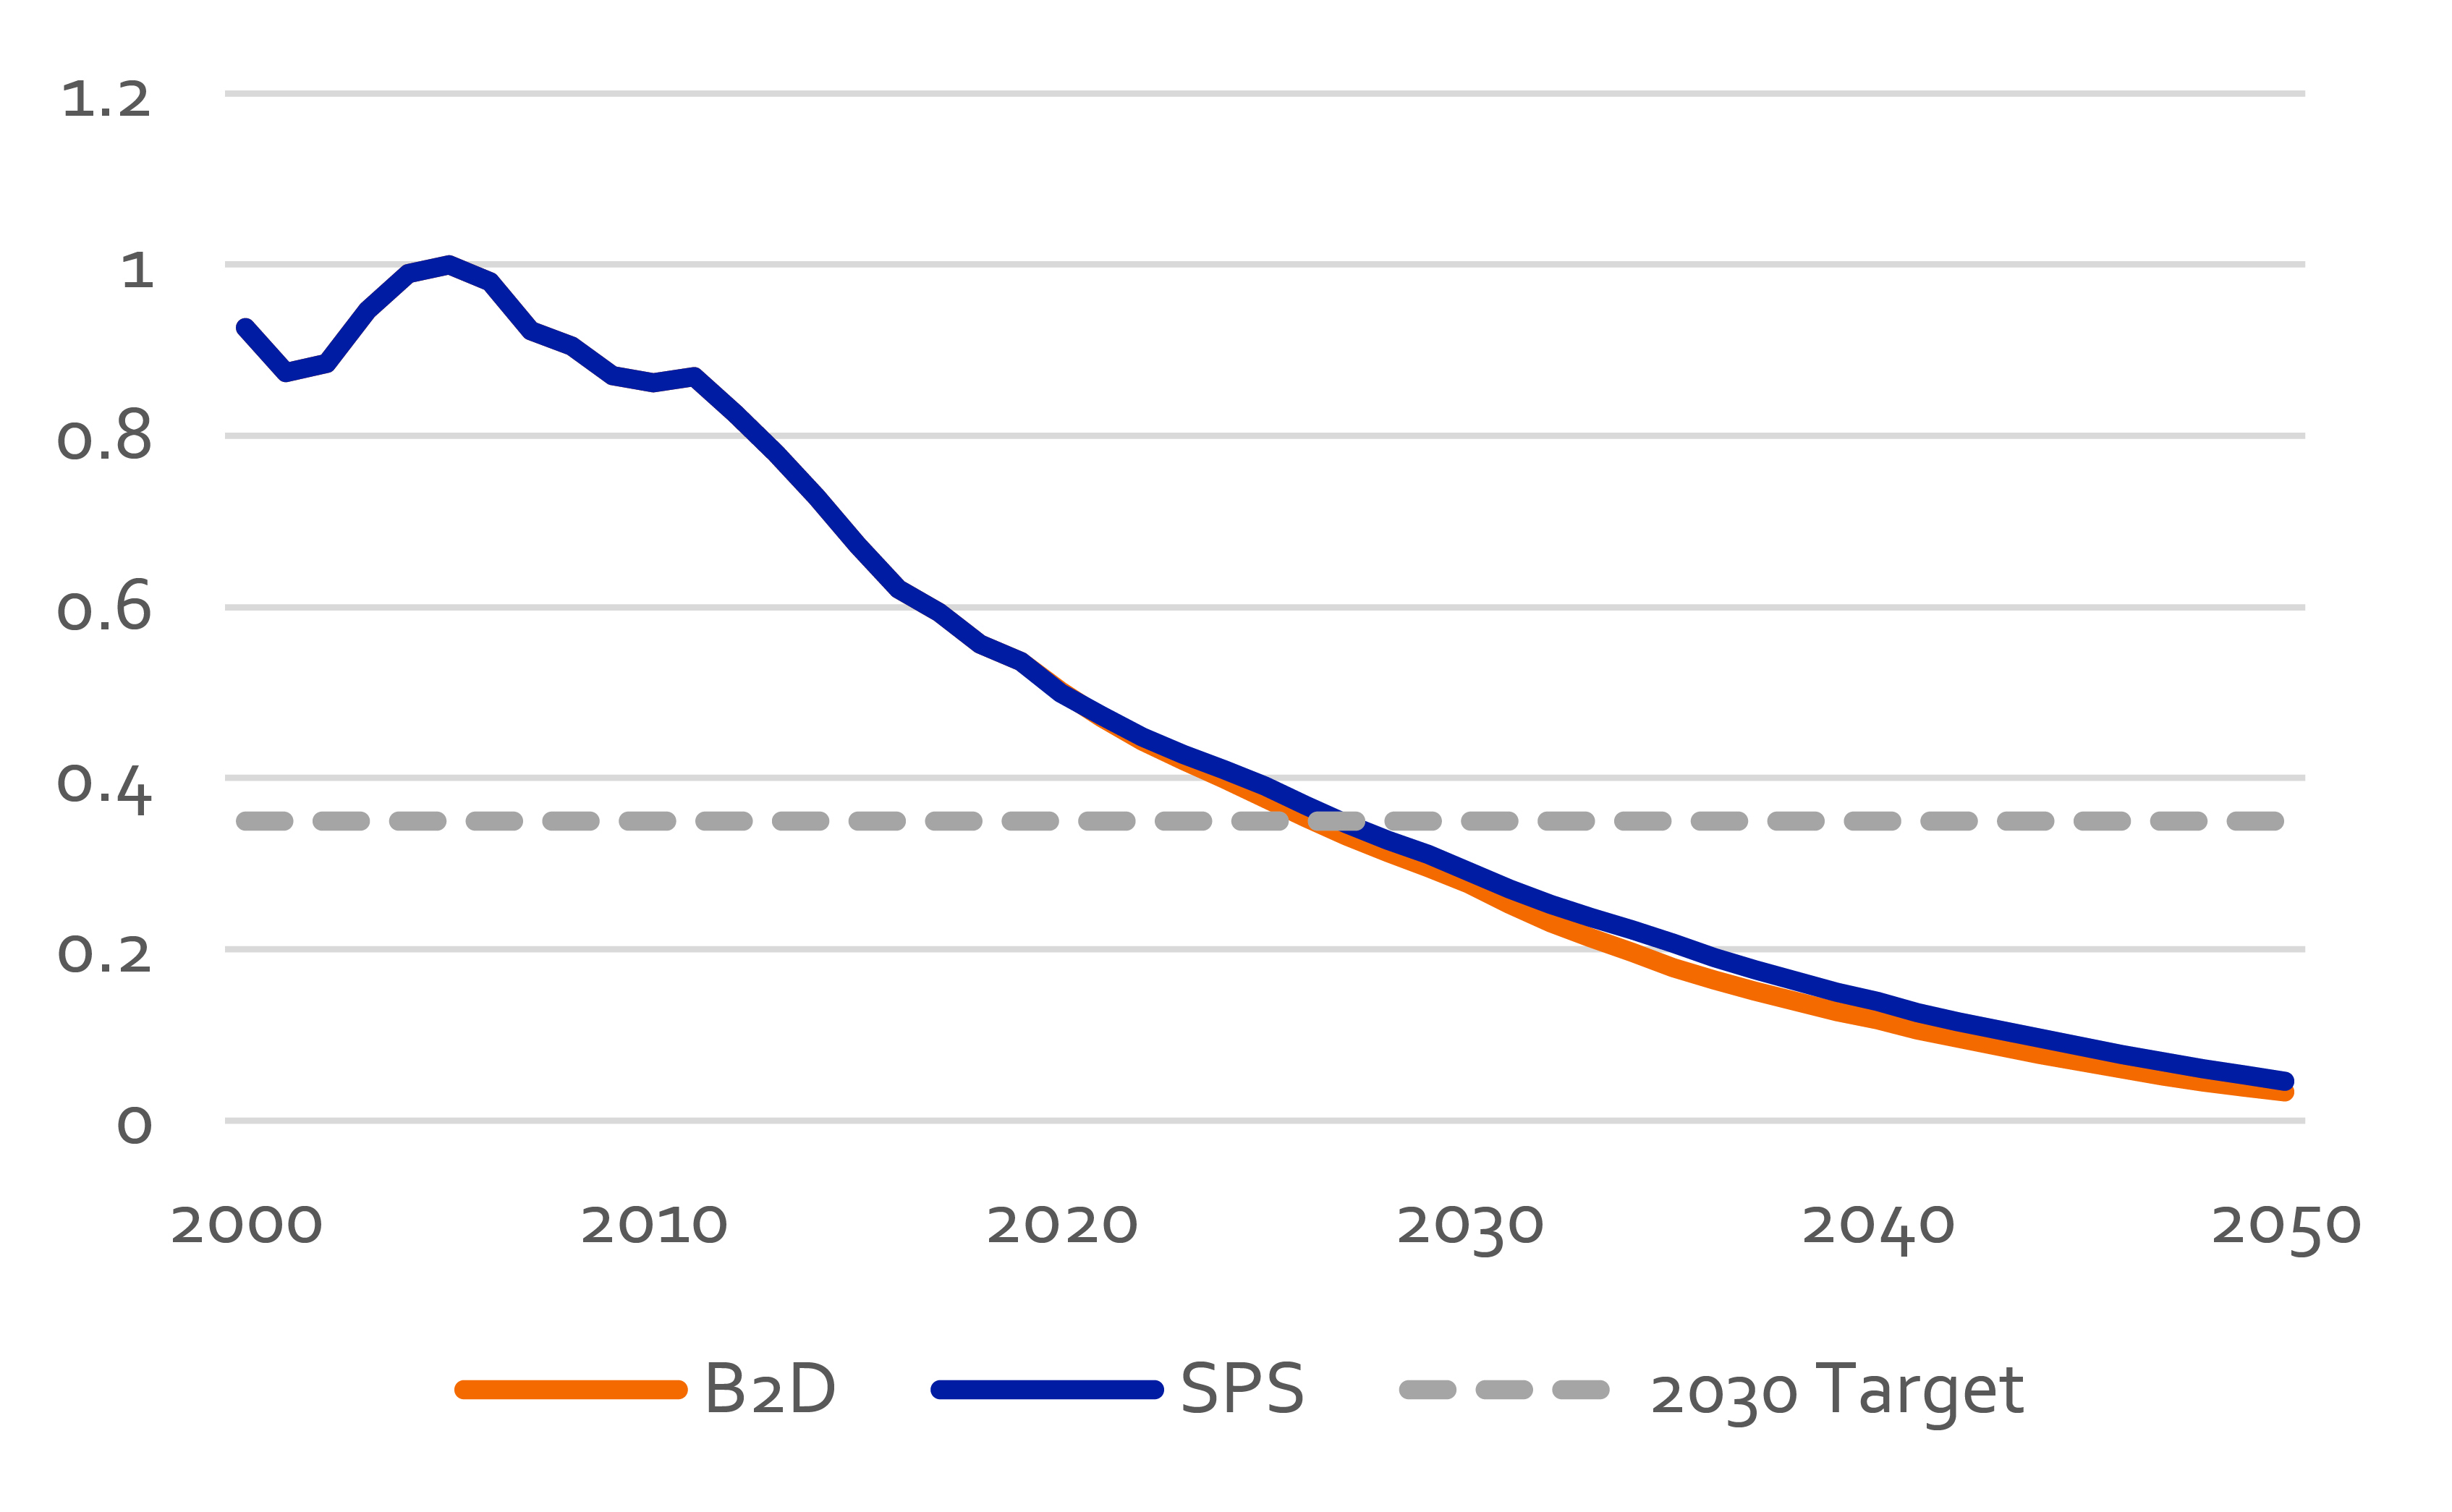
Chinese CO2 emissions per unit of GDP (Figure 10) are one time and half higher than those of the USA and three times higher than those of European Union, nonetheless they are showing a continuous improvement at a higher pace than those of USA and EU.
On the other hand, Chinese CO2 emissions per capita (Figure 11) are almost at the same level of EU and 2 times lower than those of the US; while US and EU per capita emissions are constantly decreasing, Chinese emissions followed a growing pattern that is becoming less and less steep after 2015.
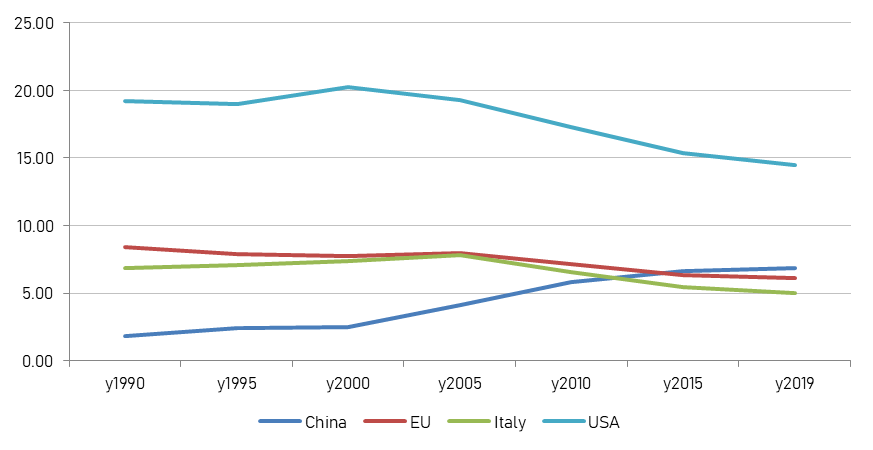
Those two indicators seems to confirm that China’s economic development is about to approach its peak emissions.
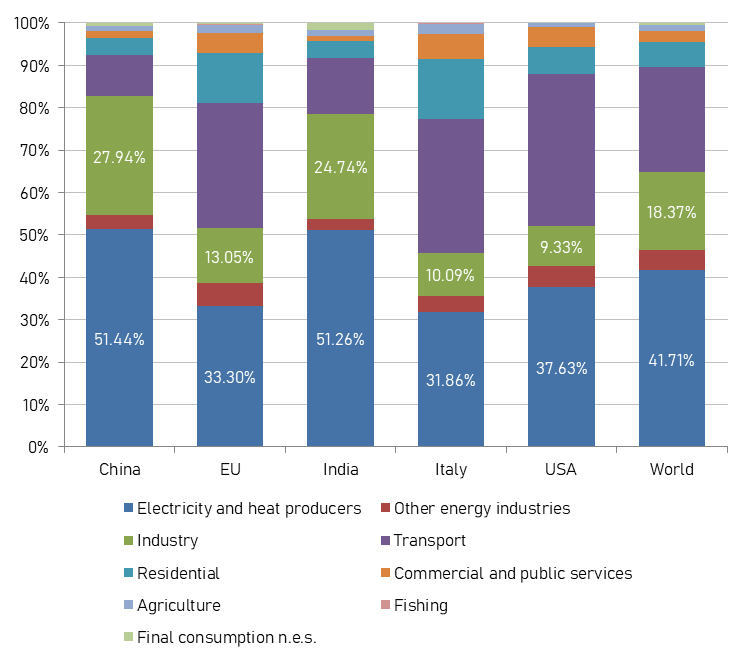
Although China is the second largest economy in the World, the CO2 contributions by sectors, compared to those of USA, European Union and others, show a pattern much more in line with the ones of developing Countries, with CO2 emissions for energy production that account for more than 50% of the total, while industry accounts for little less than 28% (Figure 12).
If China wants to achieve a swift reduction of CO2 emission, the first area of improvement is energy production by reducing the use of coal, which is the main source of energy of China and it causes around 80% of CO2 emissions by energy source (Figure 13).
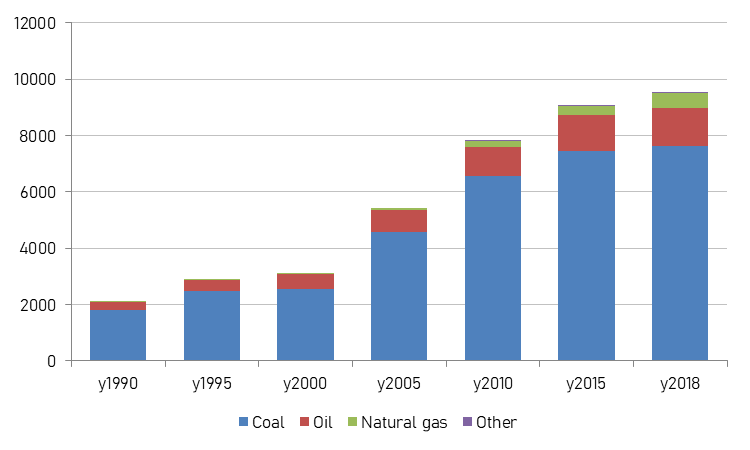
In 2019, China produced about 3.7 billion tonnes of coal and imported 300 million tonnes[3], around 57 per cent of China’s thermal coal imports and 40 per cent of its coking coal came from Australia. Amid worsening bilateral ties, China unofficially banned Australian coal in October and again in November 2020.
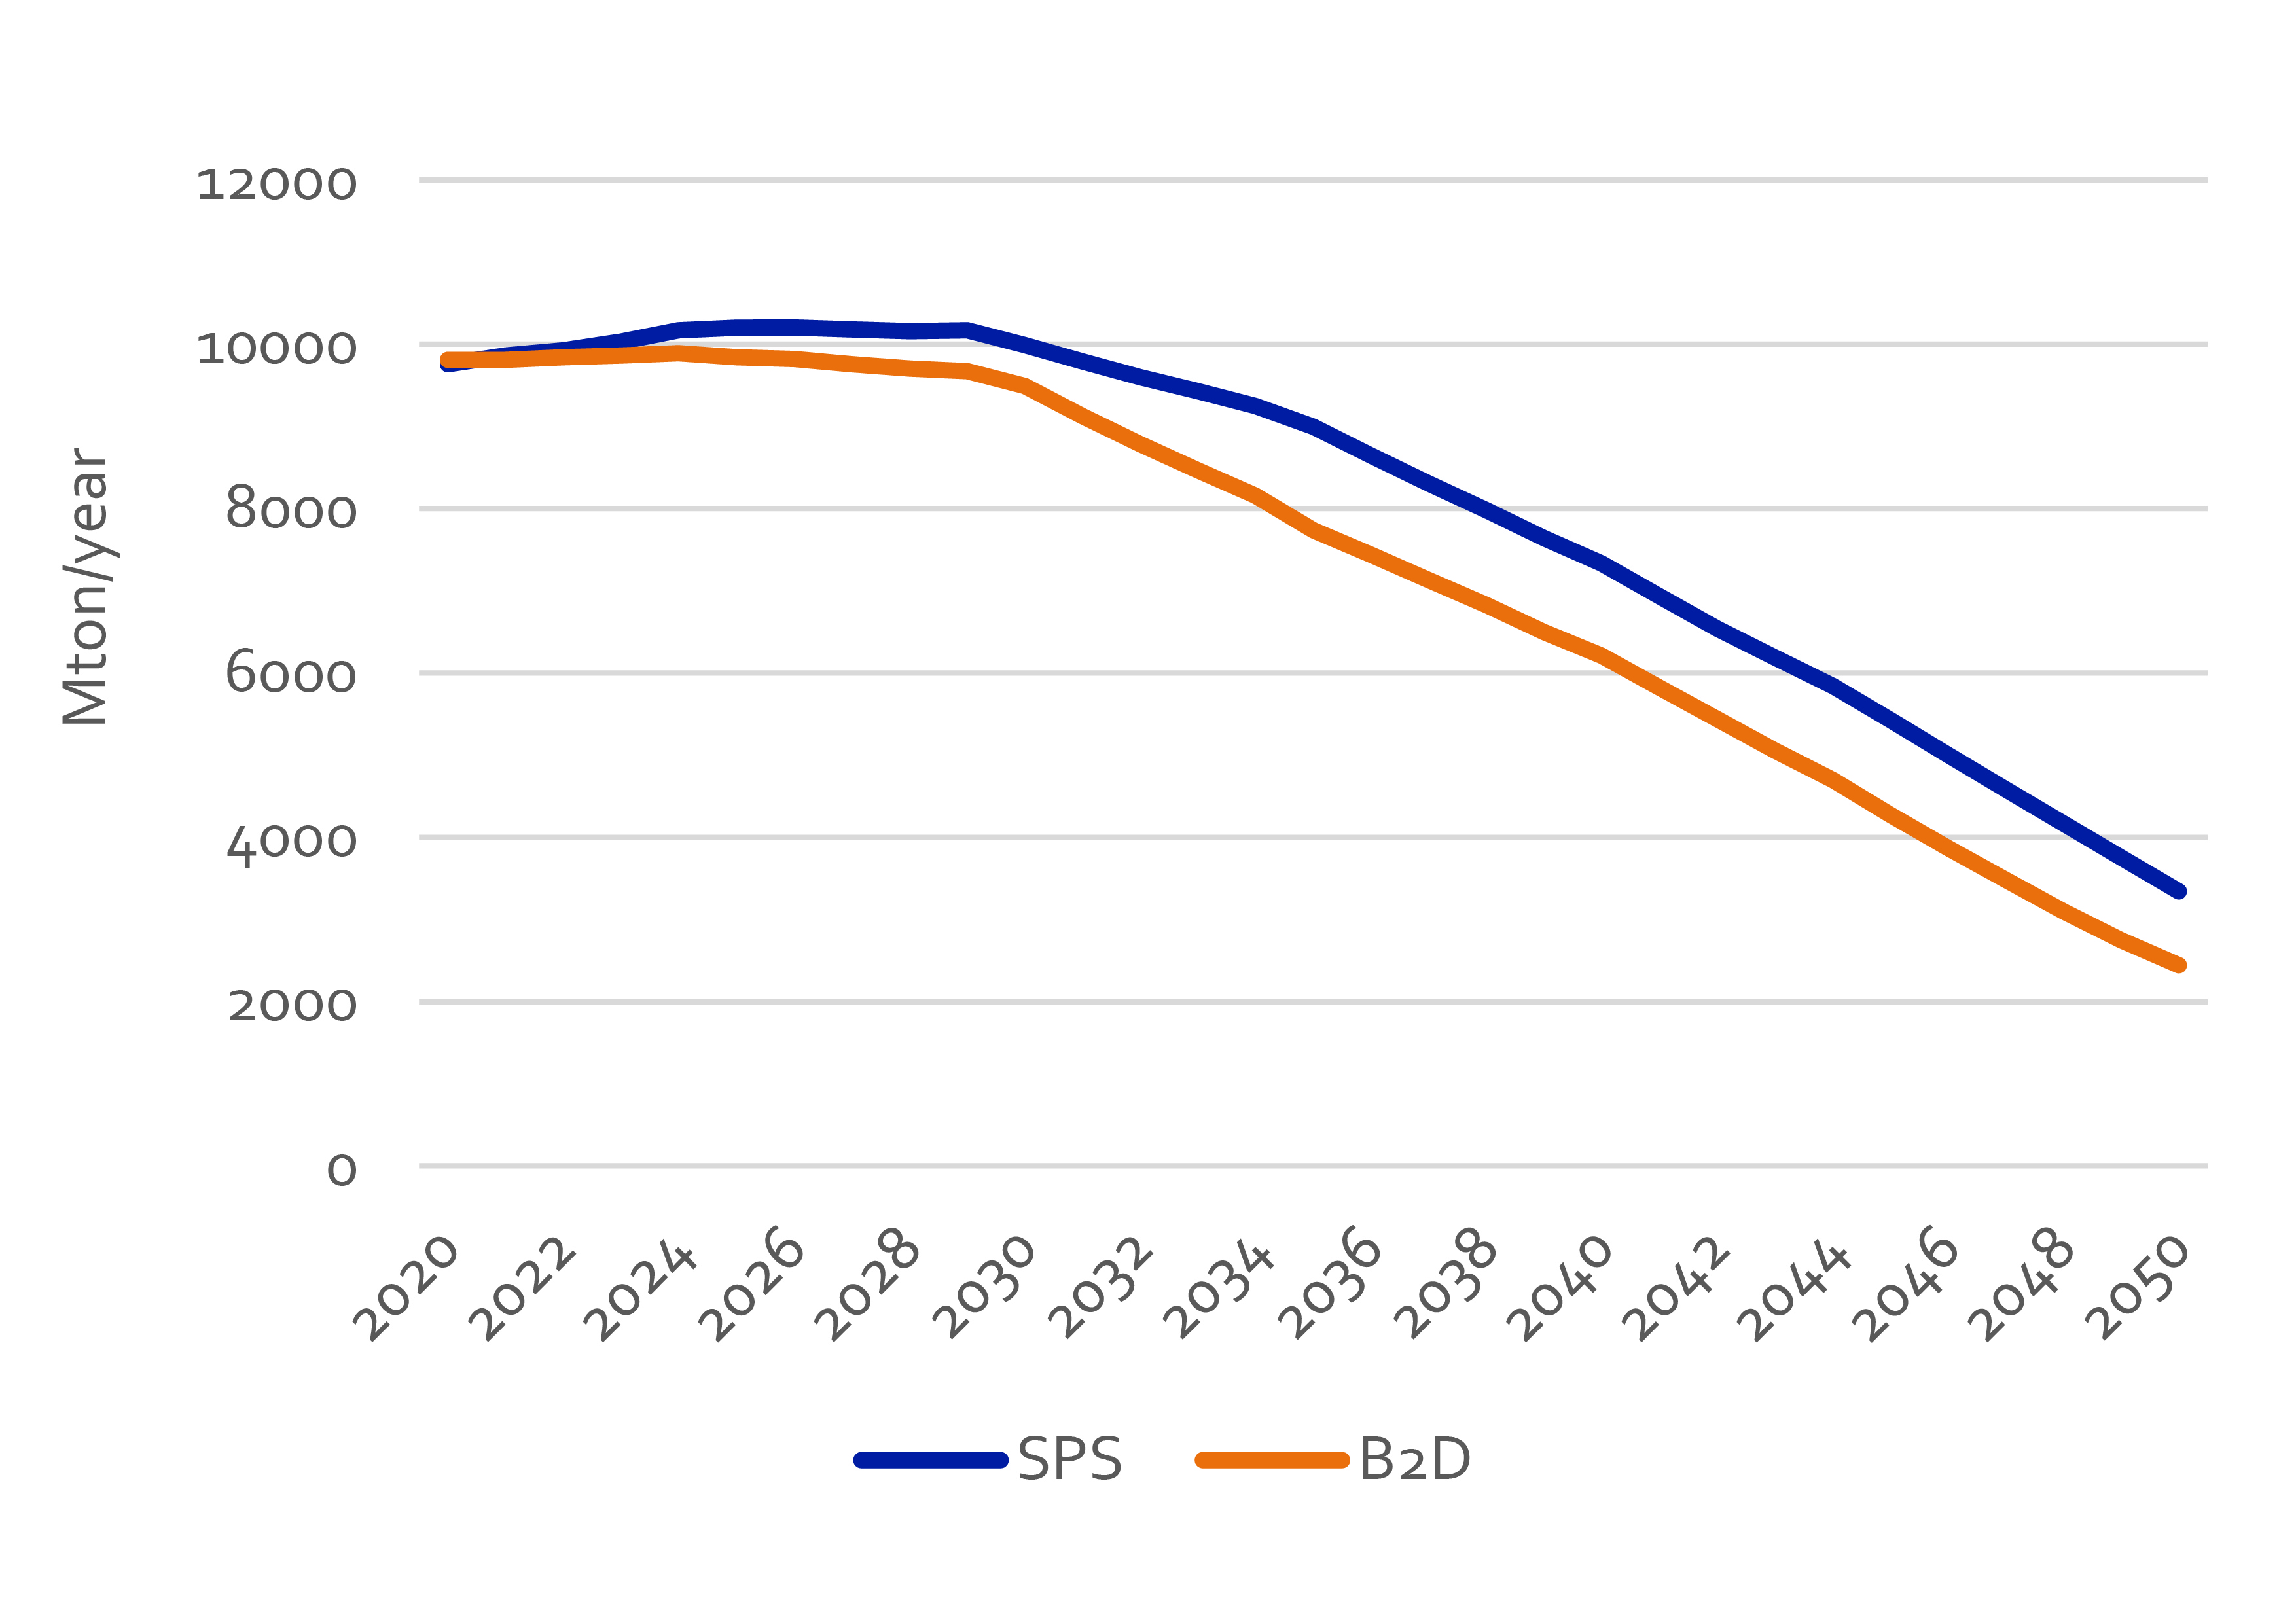
The Energy Research Institute of National Reform and Development Commission, in its 5th annual “China Renewable Energy Outlook” issued in 2020, elaborated two scenarios of CO2 reduction, one of them based on the “Stated Policies Scenario” (SPS), the other one based on the goal to achieve the “Below 2°C” scenario (B2D) (Figure 14 and Figure 15).
The strategy for the energy transition explored in the Outlook relies on three pillars:
- Energy efficiency is a critical demand-side pillar to ensure the pace and scale of supply-side deployments are adequate to support the required economic growth.
- Electrification and market reforms will change the rules of the game and create the opportunity to replace fossil fuels with electricity in the end-use consumption, in conjunction with decarbonised electricity supply.
- Green energy supply – technological progress and cost reduction allow renewable energy to provide clean energy in bulk, mainly through renewable electricity.
Coal-based power production will be gradually phased out and replaced by electricity from renewable energy, mainly solar PV and wind turbines. The share of renewables in power production shall increase to 88% in 2050 in the B2D scenario and 85% in the SPS.
The Stated Policies scenario has 707 GW of wind and 880 GW of solar to a combined 1587 GW by 2030, and the total installed capacity of wind power and solar PV is thereby higher than the target of 1200 GW. This is mainly due to the economic competitiveness of wind and solar compared with other technologies combined with the target to have a CO2 peak before 2030.
Among the main indicators listed in Article 3 of Title 1 of the 14th FYP, two binding indicators are listed in the “Green Ecology” section (#14 reduction of energy consumption per unit of GDP by 13.5%, #15 reduction of CO2 emission per unit of GDP by 18%, but indicator #20, marked as mandatory, that concerns the overall energy production capacity (which must not be less than 4.6 billion tons of coal equivalent), is listed in "National Security" section.
The 14th FYP does not include any indicator regarding the targets for GDP (differently from previous FYPs), so the indicator #15 does not define absolute values for reduction of CO2 emissions, while the focus is shifted over energy production, which is addressed in Article 11 of Title 3 "Accelerating the development of a modern industrial system, consolidating and strengthening the foundations of the Real Economy".
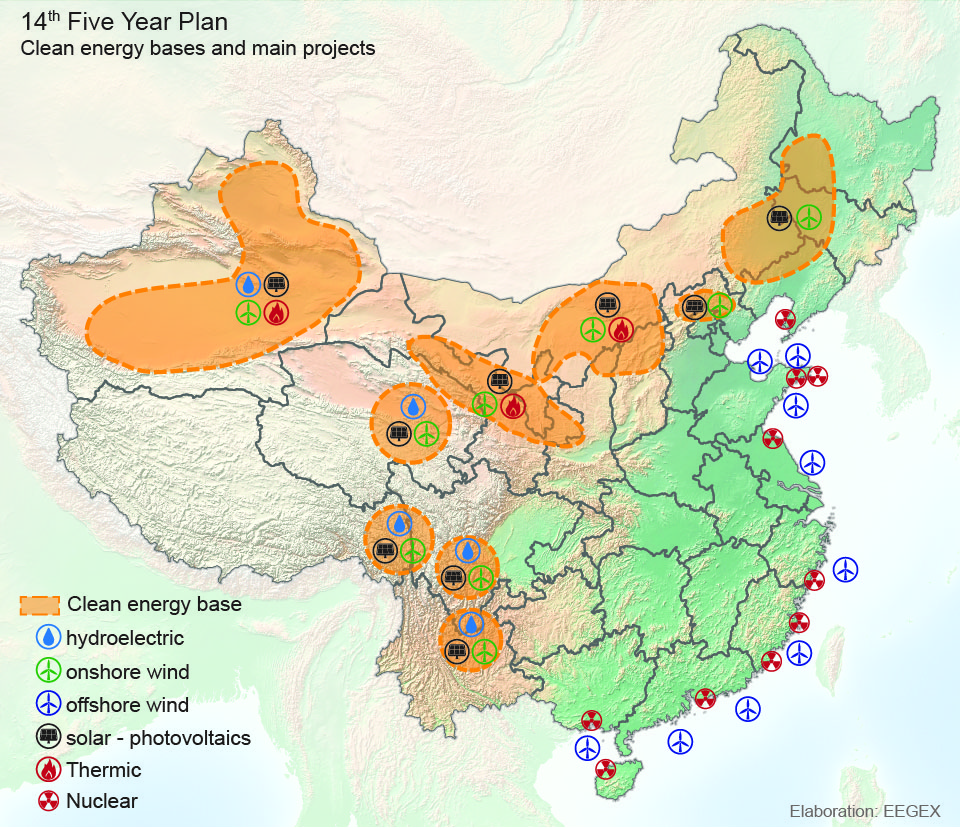
The location of the topic reveals that the decarbonisation has its raison d'être in the search for a mix that ensures the maximum possible autonomy for China, albeit in the search for a compromise also with environmental and climatic needs: 14 ° FYP proposes to increase the share of energy from non-fossil sources to 20% (in 2020 it is 15.8%), so that non-fossil sources can replace shares of imported coal.
In fact, the planned investments concern the production of hydroelectric, wind, solar and nuclear energy, as well as increasing the extension of the ultra-high voltage distribution network, also through the construction of 9 bases for the production of clean energy (Figure 16).
In conclusion, because China seems already about to reach its peak of energy and carbon intensity, because the reduction of CO2 emissions are bound to the replacement of imported coal with non-fossil sources and because those investments are part of the national security policy, most likely China will achieve Carbon Neutrality by 2060, as foreseen by the projections of the Energy Research Institute of the NDRC.
As a matter of fact, in the 14th Five Year Plan, the decarbonisation is not a strategic goal in itself, but mostly a side effect of national security and energy infrastructure modernization policies, leaving little or nothing to the industrial decarbonisation.
In addition, the projections of Energy Research Institute of the NDRC show that China could achieve carbon neutrality before 2060 and China could already set a more challenging goal, so the strategic choice, compared to the 2050 goal, is to secure ten more years of industrial development with less stringent constraints (or constraints and limitations applied with progressivity).
[1] Climate Ambition Alliance: Net Zero 2050, UFFCCC, https://climateaction.unfccc.int/views/cooperative-initiative-details.html?id=94
[2] China Water Risk, “No Water, No Growth”, https://www.chinawaterrisk.org/notices/new-cwr-report-no-water-no-growth/
[3] South China Morning Post, “China coal: why is it so important to the economy?”, 13 Feb 2021, https://www.scmp.com/economy/china-economy/article/3121426/china-coal-why-it-so-important-economy